NumPy and Pandas Proficiency: Interview Preparation
NumPy and Pandas interview preparation covers array creation, element-wise operations, statistics, DataFrames, data cleaning, and grouping. The examples calculate a NumPy array mean and create a Pandas DataFrame; related tools include Matplotlib for visualization, SciPy for scientific computing, and Scikit-learn for machine learning.
Summary written with AI from this article, and checked against it.

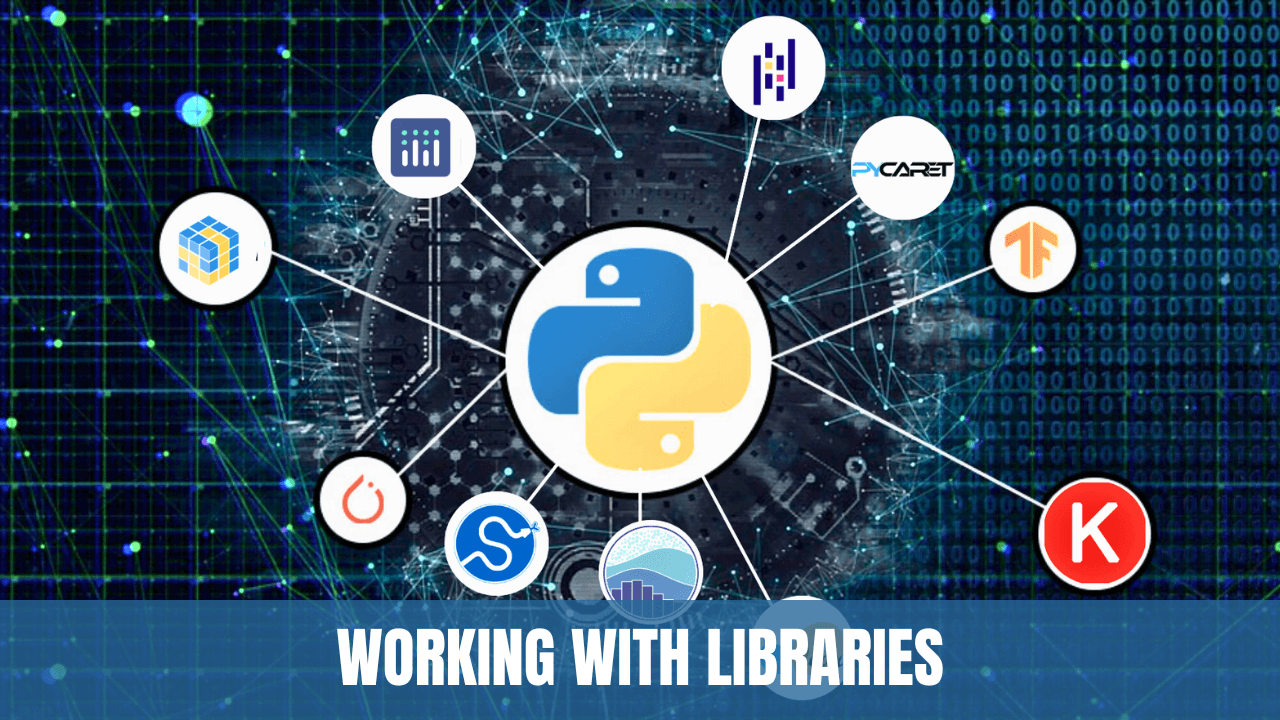
In the rapidly evolving field of data science and scientific computing, libraries like NumPy and Pandas have become indispensable tools. These libraries have simplified complex tasks related to data manipulation, analysis, and computation. For those preparing for interviews, demonstrating proficiency in these libraries can be a strong asset. This article highlights essential aspects of working with popular libraries like NumPy and Pandas.
1. NumPy
NumPy (Numerical Python) is a library that provides support for large, multi-dimensional arrays and matrices, along with mathematical functions to operate on these arrays.
Key Features:
- Array Creation: Creating arrays with different dimensions.
- Mathematical Operations: Performing element-wise operations like addition, subtraction, multiplication, etc.
- Statistical Functions: Calculating mean, median, standard deviation, etc.
Example:
import numpy as np
arr = np.array([1, 2, 3])
print(np.mean(arr))  # Output: 2.0
2. Pandas
Pandas is a data manipulation and analysis library. It provides data structures for efficiently storing and manipulating large datasets and offers functions to quickly analyze and visualize the data.
Key Features:
- DataFrame Creation: Creating and handling two-dimensional labeled data structures.
- Data Cleaning: Handling missing data, duplicates, and data transformation.
- Aggregation and Grouping: Summarizing data based on specific criteria.
- Data Visualization: Creating plots and charts.
Example:
import pandas as pd
data = {'Name': ['Alice', 'Bob'], 'Age': [28, 25]}
df = pd.DataFrame(data)
print(df.mean())  # Output: Age 26.5
3. Other Notable Libraries
Alongside NumPy and Pandas, other libraries often come into play in scientific computing and data analysis, such as:
- Matplotlib: For data visualization.
- SciPy: For scientific and technical computing.
- Scikit-learn: For machine learning.
Conclusion
Working with libraries like NumPy, Pandas, and others is an essential skill for data scientists, analysts, and researchers. Understanding how to utilize these tools for data manipulation, analysis, and visualization is vital for efficiency and effectiveness in various data-driven roles.
Whether you are preparing for a job interview or looking to strengthen your practical skills, gaining proficiency in these libraries will undoubtedly enhance your ability to handle complex data tasks. Numerous tutorials, documentation, and community forums are available online to support your learning journey. By investing time in mastering these tools, you will be well-equipped to demonstrate your skills in the next interview or professional challenge.
Interview flashcards
What is NumPy used for?
NumPy supports large, multi-dimensional arrays and matrices and provides mathematical functions to operate on them. Its name stands for Numerical Python.
What mathematical operations can NumPy perform on arrays?
NumPy can perform element-wise mathematical operations on arrays, including addition, subtraction, and multiplication.
What statistical calculations does NumPy support?
NumPy supports calculating mean, median, and standard deviation. Calling np.mean on an array containing 1, 2, and 3 returns 2.0.
What is a Pandas DataFrame?
A Pandas DataFrame is a two-dimensional labeled data structure. Pandas supports creating and handling these structures for data manipulation and analysis.
What data cleaning tasks does Pandas support?
Pandas supports handling missing data and duplicates, as well as data transformation.
What are aggregation and grouping used for in Pandas?
Aggregation and grouping are used to summarize data based on specific criteria.
What visualization capabilities does Pandas provide?
Pandas provides data visualization functions for creating plots and charts.
What are Matplotlib, SciPy, and Scikit-learn used for?
Matplotlib is used for data visualization, SciPy for scientific and technical computing, and Scikit-learn for machine learning.
Written with AI from this article, and checked against it.

About the author
Vishal · Software & security engineerVishal writes Trickyworld's tutorials and interview-preparation guides on programming, databases, cyber security and AI. Vishal has been shipping production software long enough to have firm opinions about Python, PHP, Node.js, and JavaScript, and to have been wrong about each of them at least once. The work has run the whole stack: Drupal and Laravel applications, React front ends, MySQL and MongoDB underneath, Redis and Memcached for the things that had to be fast, Apache Solr for the things that had to be findable. That last part turned out to matter more than anyone expected. Tune a Solr index for a season, then watch a language model confidently retrieve the wrong document, and you recognise an old problem wearing new clothes. Most of what is hard about AI systems is not the model. It is retrieval, caching, latency budgets, and deciding what the system does when the answer comes back wrong — which is work he has been doing since well before anyone called it AI engineering. He plays a lot of games, which is less a hobby disclosure than an admission of where a good share of his engineering instinct came from. Real-time systems with a frame budget. State that has to stay coherent while a player does something no designer anticipated. The permanent question of what happens when the frame cannot finish in time. Those habits carry over more directly than they have any right to. He has written several books on programming, all built on the same conviction: most technical writing is unclear because the author never decided what to leave out. More from Vishal → · Editorial policy